Taming Tail Latency and Achieving Predictability
Twitter is accelerating its Pelikan Cache framework by using the Intel® Ethernet 800 Series Network Adapter with Application Device Queues (ADQ).
Delivering data from in-memory cache should be the fastest method among all possible remote sources in a data center. (As described by Wikipedia, cache is “a hardware or software component that stores data so that future requests for that data can be served faster; the data stored in a cache might be the result of an earlier computation or a copy of data stored elsewhere.”)
I have long held the belief that predictable latency is more important than throughput in a production environment for several reasons. Among them is the observation that you can horizontally scale your way toward any throughput target, but there is no easy fix for latency spikes. The importance of tail latency also increases with scale, in particular, the width of request fanouts. Production caches at Twitter adhere to a strict service-level objective (SLO) of p999 < 5 milliseconds (ms). In other words, our goal is to serve 99.9 percent of the requests under this amount of time.
Cache at Twitter
Twitter has been using and developing a variety of cache services for many years. Its data center environment consists of more than 400 cache clusters, running as tens of thousands of instances on thousands of hosts. These clusters are highly diverse in their data type, access pattern, object size, connection count, and throughput. A cache that works for Twitter must be fast and scalable, and it needs to be operationally stable and flexible.
An Open Source Cache Framework: Pelikan Cache
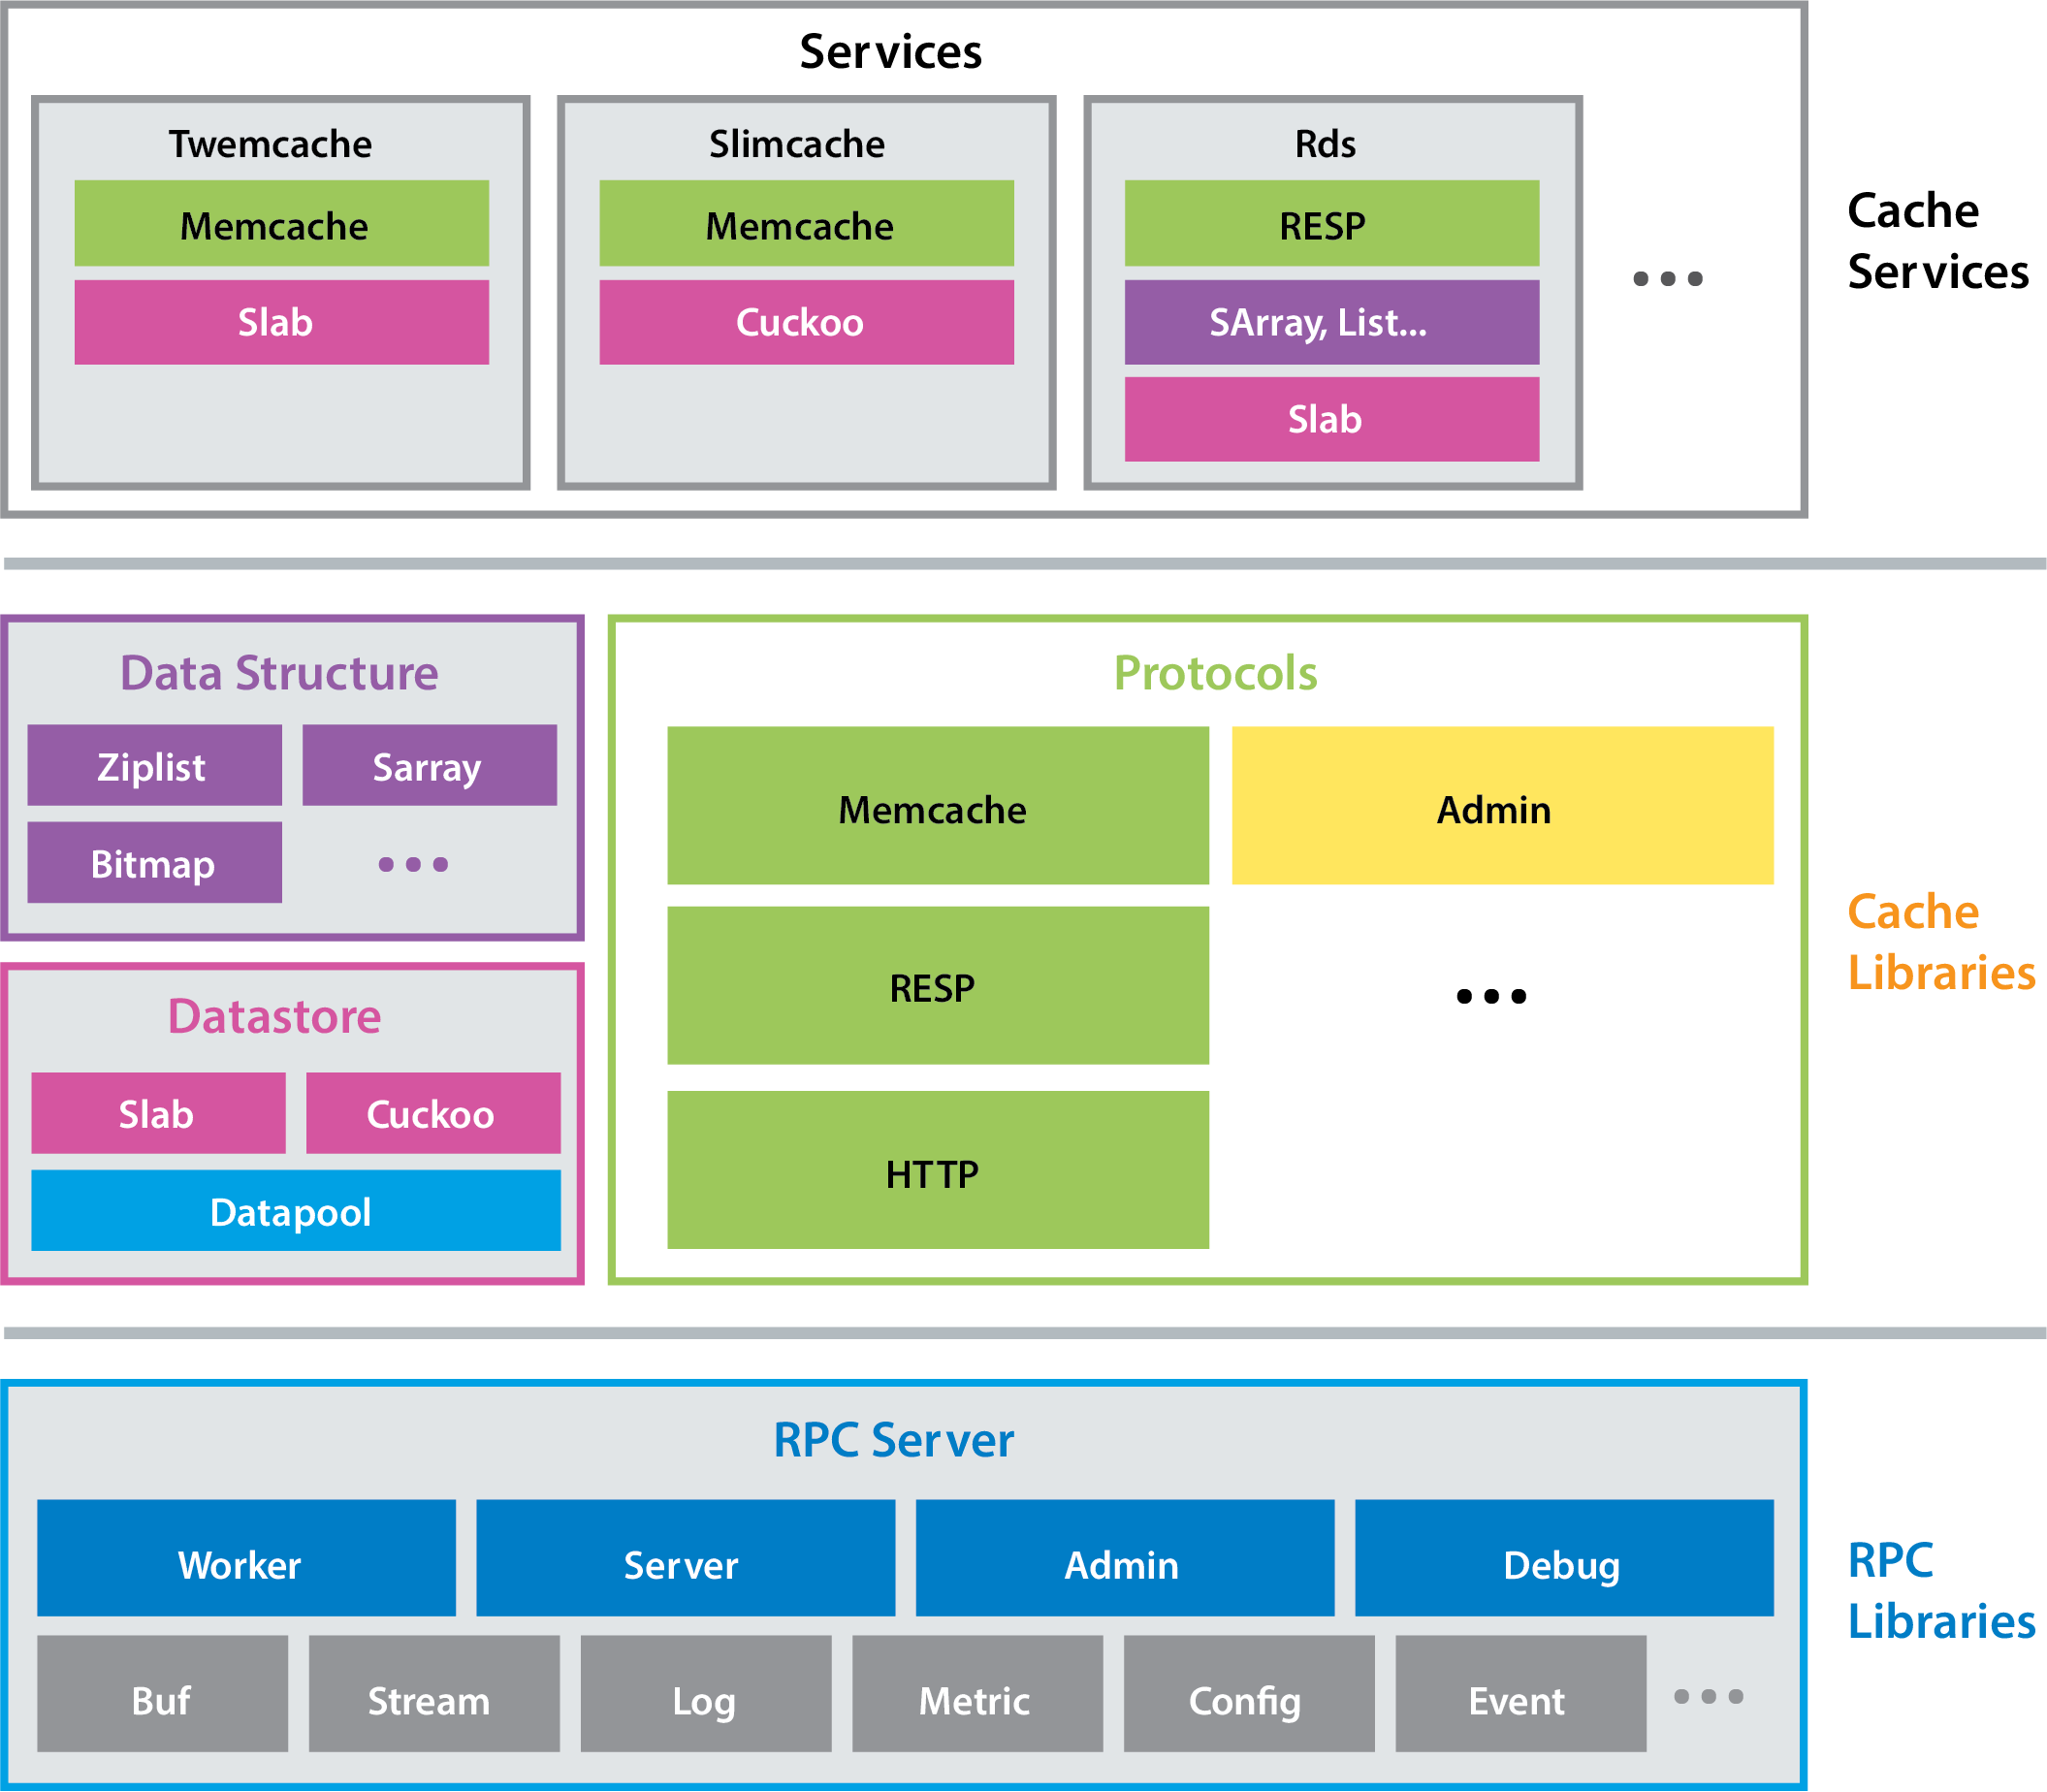
Based on our production observations about cache performance and how it is closely tied to network performance, we built Pelikan Cache— a modular caching framework that provides an expanding collection of cache services, and includes a common library for building those services. This framework approach allows us to quickly develop new features and protocols.
Pelikan Cache separates performance-sensitive processing from the less
performance sensitive processing, and it separates different types of
performance-sensitive processing from each other. Data request-response
processing and connection establishment are assigned to the data plane (the
“fast path”). Everything else is assigned to the control plane. Each major
processing pipeline gets its own thread— worker, server, admin, and
debug (see Figure 1).
Pelikan Cache brings several benefits to Twitter’s caching:
- Separation of control and data plane
- Data plane operations are guaranteed to be nonblocking, using lockless data structures to deliver low latencies
- Per-module configuration options and metrics that can be easily composed
- Multiple storage and API protocol implementations, and the ability to easily combine and extend them
- Low-overhead command logger that keeps up with full throughput and captures all request metadata for analysis
A Tail Out of Control
Despite fully optimizing for latency within the cache application itself, the tail—that small percentage of response times that take the longest compared to the overall response times—is often determined by system factors. The tail latency typically rises dramatically when packet rate and transmission control protocol (TCP) connection count are both high. Other factors can include suboptimal scheduling decisions from the scheduler (Completely Fair Scheduler, or CFS, is the default used at Twitter) and difficulty in achieving resource isolation in a shared, containerized environment. The fast path’s lack of isolation makes performance liable to degradation due to interrupt bursts, contention between applications, excessive CPU migration, and cache pollution.
Some of these problems can be mitigated by applying CPU affinity and network
adapter tuning, especially queue/irq parameters. However, these optimizations
do not change how the expensive handovers happen, which include interrupting
(with sirq) the kernel to process packets after dequeuing from the network
adapter, and waking up the application to process sockets with pending data.
Sure, there are the bold and brave who bypass the kernel networking stack
using the Data Plane Development Kit (DPDK), but it
requires substantial changes to the application, and the setup interacts poorly
(if at all) with containers. Streamlining these context-switch laden steps
without turning the application upside down is the primary reason I was very
interested in Intel’s new generation of network adapters.
An Easy Button for Traffic Isolation
In 2020, Intel released the Intel® Ethernet 800 Series Network Adapter, which ships with Application Device Queues (ADQ). ADQ is an open technology designed to help address network traffic challenges by improving throughput and latency, and enabling greater predictability in application response times. It is supported by Linux kernel 4.19 or later. ADQ lets software applications reserve queues (“express lanes”) explicitly on the network adapter. It also provides interfaces that application threads leverage to access the preserved queues.
The purpose of ADQ is to increase application response time predictability within the realm of the network and networking software stack—especially as systems scale—with an easy-to-use interface. ADQ offers flow segregation at the network adapter queue level by offloading some aspects of flow management to hardware, and it allows the application to directly poll reserved queues with little or no code changes. The ease-of-use aspect is just as important. For the vast majority of businesses, including Twitter, benchmark advantages are easily overruled by operational constraints. A technology that can be readily deployed is one that can have actual impact.
To learn more about how ADQ works with Linux, refer to my notes here.
Test for Rough Terrain
To evaluate ADQ, we created a test plan that simulates Twitter’s production environment while pushing things much further along dimensions we think are important.
First, cache instances are stacked. This mimics a containerized environment that aims to fill most available quota. The instance limitation of our current container scheduler is 24 instances per host, and that is the number we use here. Second, each cache backend handles a relatively large number of connections, which goes up to 10,000 per instance. This arrangement is based on the observation that the network stack performance tends to degrade with an increasing number of flows. In addition, high connection count is very common for cache clusters that are directly queried by application jobs. With direct connection, each application instance needs to open a connection to every cache backend. A large application with thousands of instances will create thousands of connections to each cache backend. We surveyed our production environment and determined that 240K connections per host gets us well into the tail of concurrent connections per host. Third, we wanted to test a wide range of payload sizes. Knowing the network bottlenecks from experience, we expected the payload size to also play a role in both throughput and latency.
Table 1: Master Test Plan
| Key Parameter | Value(s) |
|---|---|
| Instance per host | 24 |
| Object size | 64,4096 |
| Connection count | 100,500,1K,2K,5K,10K (x24) |
| Throughput (qps) | 500K,1M |
| Latency metrics | p999(99.9%),p9999(99.99%) |
Basic Setup
We tested against Pelikan Cache, specifically pelikan-twemcache, which supports Memcached-compatible APIs. For clients, we used rpc-perf, another open source project developed at Twitter for benchmarking Remote Procedure Call (RPC) performance. The client and server configurations used for our tests are here.
Note: We did not allow pipelining or batching because they both tend to be very limited in Twitter production, and we wanted to maximize the pressure on the networking stack. Also, only the Pelikan Cache server had ADQ enabled; it wasn’t enabled on the rpc-perf clients. This was to mimic the initial scenario where we won’t have ADQ-enabled network adapters everywhere. These decisions made our results somewhat pessimistic in terms of performance.
Generic Optimization
We found that ADQ was relatively easy to set up. We started by ensuring tc
offload was turned on, and then set aside the right number of queues in the
right class, reserving one per Pelikan instance. Next, we configured flow
classification filters (using Intel® Ethernet Flow Director) to point each queue
to its corresponding dst port. Finally, we set up the network cgroups. Once
the tests were complete, the system was reset by removing the network cgroups
used. We used this script
for host setup.
The Appendix provides the detailed parameters of our test configuration.
Results
The test results shown in Figures 2, 3, and 4 were collected by rpc-perf against the full range of our test parameters, capturing latencies at p999 and p9999. The Y-axes are shown in log scale due to the wide range of values. These charts use box plots, where the orange line segments show the mean value, the colored boxes show the range of values with 0.95 confidence.


At 1M QPS, with a 64-byte payload and a 4,096-byte payload (see Figure 2), it is very difficult for the non-ADQ configuration to consistently stay within the p999 of 5ms SLO at or beyond 500 connections per instance, even when the payloads are tiny. This aligns with our observation of other network adapters, where we occasionally see outliers that have tail latencies seemingly out of control for no obvious reasons. In contrast, the ADQ configurations easily handled both the 64-byte and 4 KB payloads. Putting these two side by side, we observed a 10x reduction in tail latencies in some clients.
Reviewing the p9999 latencies (see Figure 3), the same pattern holds true, where the mean of non-ADQ latencies is rising significantly while ADQ latencies show a much more modest increase. Thus, we could probably change our definition of cache SLO to be about p9999 instead of p999, and we could tighten the range down from 5ms to 2-3ms.


We then downsized the throughput of the non-ADQ configuration to 500K QPS to learn if it would hold up; Figure 4 shows the results. If we go by the boxes (showing 0.95 confidence range) instead of the worst data points, we can just barely declare the non-ADQ configuration as usable at 500K QPS.

Conclusion
The Intel Ethernet 800 Series Network Adapter with ADQ technology did an outstanding job in reducing tail latency of RPC requests over a broad range of sizes and connection counts. The consistent reduction in tail latencies is the biggest improvement I’ve seen in a decade, to the point that I think we should upgrade our cache SLO to match. ADQ also frees us from worrying about the impact of connection counts on both latency and throughput, and it allows us to safely provision more than 2x the throughput while upholding the same SLO. ADQ achieves this with a relatively simple system configuration and no application changes in the case of Pelikan Cache. The combination of these two aspects means we have a clear path for putting this setup in production in the near future.
We also tested Pelikan Cache using Intel® Optane™ persistent memory (Intel® Optane™ PMem) for storage, and we believe the results from the test described in this article will largely hold regardless of whether we use DRAM or PMem. We will provide a detailed discussion of how we set up our PMem experiment in a separate post. Please check back at our blog for updates. We hope our experience with ADQ is helpful for those who are interested in experimenting with new networking technologies.
Credits
Most of the data in this article are from experiments conducted by Juncheng Yang. We received technical support from Intel, especially Anil Vasudevan and Dinesh Kumar, who greatly furthered our understanding of the technology. This blog was written with assistance from Todd Koelling at Intel and Kaia Communications.
References
Appendix
Table 2: Test Configuration
| System under Test (SUT) | Client | |
|---|---|---|
| Test by | ||
| Test date | 10/8/20 | 10/8/20 |
| Platform | Twitter Fifth Generation Compute System | Twitter Third Generation Compute System |
| # Nodes | 1 | 24 |
| # Sockets | 2 (only 1 socket used for this test) | 2 |
| CPU | Intel® Xeon® Gold 6230R Processor @ 2.1GHz | Intel® Xeon® E5-2683v4 Processor @ 2.1GHz |
| Cores/socket, Threads/socket | 26 Cores/socket, 52 Threads/socket | 16 cores/socket, 32 Threads/socket |
| ucode | 0x5002f01 | 0xb00002e |
| HT | On | On |
| Turbo | On | On |
| BIOS version | N/A | N/A |
| System DDR Mem Config: slots / cap / run-speed | 8 slots / 64x8GB / 2933 MT/s DDR4 | 8 slots / 32x8GB / 2400 MT/s DDR4 |
| System DCPMM Config: slots / cap / run-speed | N/A | N/A |
| Total Memory/Node (DDR+DCPMM) | 512 GB | 256 GB |
| Storage - boot | SAMSUNG MZQLB960HAJR-00007 | Intel® SSDs C2BB48 |
| Storage - application drives | N/A | N/A |
| Network Adapter | 1x Intel® Ethernet Network Adapter E810-CQDA2 @ 100 Gbps | MT27500 Family [ConnectX-3] |
| PCH | Intel® C620 Series Chipset | Intel® C610/X99 Series Chipset |
| Other HW (Accelerator) | N/A | N/A |
| OS | CentOS 7.5 | CentOS 7.5 |
| Kernel | 5.4.38-t2.el7.twitter.x86_64 | 4.14.127-t8.el7.twitter.x86_64 |
| IBRS (0=disable, 1=enable) | 1 | 1 |
| eIBRS (0=disable, 1=enable) | 1 | 1 |
| Retpoline (0=disable, 1=enable) | 1 | 1 |
| IBPB (0=disable, 1=enable) | 1 | 1 |
| PTI (0=disable, 1=enable) | 0 | 1 |
| Mitigation variants (1,2,3,3a,4, L1TF) | 1,2,3a,4 | 1,2,3,3a,4,L1TF |
| Workload & version | pelican_twemcache (SHA 1f603ec) | rpc-perf (SHA d9d587c) |
| Compiler | gcc (GCC) | rustc |
| Network Adapter Driver | ice 1.0.4 | mlx4_en 4.0-0 |
Table 3: ADQ Related
| ADQ “Off” Baseline | ADQ “On” | |
|---|---|---|
| System Settings | ||
| Interrupt Moderation | Fixed | Fixed |
| IRA Balance | No | No |
| Interrupt Affinitization | Yes | Yes |
| ADQ Settings | ||
| Epoll Busy Poll | Yes | Yes |
| Socket Option for NAPI ID | No | No |
| TC-Mqprio Hardware Offload and Shaper | No | Yes |
| TC- Cloud Filter Enabling with TC-flower | No | Yes |
| Symmetric Queueing | No^ | Yes |
^: Symmetric queueing was unintentionally turned off for the ADQ “Off” Baseline case. However, it is not expected to change our conclusion.